Page History: PSD Analyzer Element
Compare Page Revisions
Page Revision: 2015/06/14 19:49

|
PSD Analysis Element
|
| Info |
| Category: |
Signal Analysis |
|
AddIn: |
Signal Processing |
| Creator: |
OkazoLab Team |
|
Scope: |
Parent Event |
| Owns Snippets: |
no |
|
Usage: |
Status Screen, code snippets |
Actions aligned with epochs of the parent event
| Epoch | Actions |
|---|
| After Onset | The element starts analyzing the selected signal |
| Control Loop step | Latest signal samples is analyzed within the selected analysis window and the PSD plot gets updated. |
| Before Offset | The element stops analyzing the selected signal |
Properties
Generic Properties
| Name | Property description | Constraints | Type | Upon change |
|---|
| Settings |
| Selected Signal | Defines the signal for processing by the element. The signals are provided by the data acquisition elements. | | String |
|
| Sampling Rate | Defines the sampling rate of the original signal, in Hz | | Int32 |
|
| FFT Settings |
| Analysis Window Size | Defines the size (in samples) of the moving analysis window for signal processing. | | Int32 |
|
| Range Of Interest | Defines the 'range of interest' across all signal frequencies for statistics, such that the dominant frequency is searched within the range only. The range also restrains X-bounds on the generated plot. | | clRange |
|
| Bin Size | Defines the bin size for the frequency dimension in statistics and plotting. | | double |
|
| Power Normalization | Defines the normalization procedure that is automatically applied to the results of FFT | | enum | The selected procedure is applied on the next analysis cycle |
| Fourier Options | Defines the computation options for the FFT | | enum | The selected options is applied on the next analysis cycle |
| Runtime Status |
| Is Running | Defines whether the analysis and plotting is going on in the present. You can use this property to temporally cease the signal processing for a sake of performance. | | Boolean |
|
| Dominant Frequency | Returns the dominant frequency in the signal power spectrum within the selected range of interest, in Hz | | double |
|
| Dominant Power | Returns the power of the dominant frequency in the signal power spectrum within the selected range of interest, in Hz | | double |
|
| XAML PSD Plot | Returns a live XAML signal plot showing the power spectrum within the selected range of interest. The plot can be used for direct binding to the Content property of the XAML ContentControl element, e.g. The ContentControl with a generated plot can be shown on the status screen or by the XAML Layout element. | | XAML UIElement |
|
| Frequency Spectrum | Returns an double array of the newest signal samples. The array length is equal to the size of the analysis window. The values are updated on every Control Loop cycle of the parent event. The last item in the array corresponds to the most recent signal sample. | | double[] |
|
| Plotting |
| Plot Title | Defines the title of the generated PSD plot | | String | The signal plot is updated |
| Plot Theme | Defines a visual theme of the generated PSD plot | | enum | The signal plot is updated |
| Bar Color | Defines the color of the bars on the generated PSD plot | | stColor | The signal plot is updated |
| Max Y-Axis | Defines the range of the Y-axis (power) on the generated PSD plot. Zero value denotes the auto-range. | | Double | The signal plot is updated |
| Rendering Size | Defines the size of the generated plot in pixels. The plot is automatically stretched on rendering, but a larger rendering size improves the chart quality with some cost in performance. The rendering size is also used as the resulting image resolution, when the plot is exported into a file. | | clSize |
|
+=== Properties inherited from clElement ===
Inherited properties of clElement
| Name | Description | Constraints | Value Type | Upon Change |
|---|
| Control |
| Is Enabled | If set to false the element is completely omitted when the experiment is run. | | Boolean |
|
| Title | Title of the element. | | String |
|
The element allows to perform a simple power spectrum (PSD) analysis on a real-time signal that is provided by the signal acquisition elements in EventIDE.
Description
The
signal acquisition elements, e.g.
OpenViBE Signal, communicate with recording hardware and buffer incoming data samples at the background of the experiment. If you want to obtain the instant frequency characteristics of a signal, you can use PSD Analyzer. The element operates on a single signal by estimating its power spectrum with the
FFT. The estimation is run cyclically in the control loop of the parent event, within a analysis window that embraces the selected number of recent samples. The results include the descriptive statistics over a subset of the signal window: dominant frequency and its power. Other statistics can be done manually, hence the element delivers the FFT output as an array of double numbers. When power spectrum monitoring is required, the element generates a live power/frequency plot, which can be placed on the
Status Screen (see the snapshot below).
Snapshots
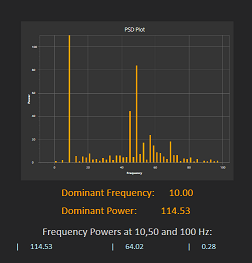 Status Screen with the PSD plot, frequency statistics
and selected powers |
Practical Use
Preparing the element for analysis
- Make sure that your experiment contains one of the data acquisition elements, e.g. OpenViBE Signal element
- Prepare the data acquisition element, such that it is set to collect at least one signal.
- Add new PSD Analyzer element to the event, where you plan to process the signal (the element operates only within the parent event).
- Select the added element to browse its properties in the Property panel.
- Define a signal for processing, via the Selected Signal property.
- Adjust the Sampling Rate property such that the value matches to the real sampling rate of the selected signal.
- Choose the size of the analysis window via the corresponding property.
- Select the Range Of Interest for statistics and plotting.
- Define the bin size for the frequency dimension in statistics and plotting.
- Choose the Power Normalization procedure (the default is normalization for the total signal maximum).
Creating the signal plot
- Create a proxy variable linked to the XAML PSD Plot property
- Check the plot's visualization settings in the Plot Settings group
- Add a XAML content control with data binding to the Status Screen code:
<ContentControl Content='{Binding XAMLPSDPlot}'/>
Reading the FFT results in code
- Create a proxy variable linked to the Frequency Spectrum property
- Use the Control Loop snippet of the parent event to monitor all signal updates
- Create a loop to read all signal samples:
// estimating the spectrum sum

double Sum=0;

for (int i=0;i,FrequencySpectrum.Length;i++)

{

Sum=Sum+FrequencySpectrum[i];

}
Notes
- The Frequency Spectrum values are raw, so you may need to make a conversion to Hz based on the size of analysis window and sampling rate. In contrast, element's statistics and plot automatically scale the FFT results to Hz.
- The dominant frequency and power are searched only inside of the chosen range of interest.
- The frequency spectrum is returned for the entire analysis window, irrelative to the chosen range of interest.
- You can measure a time of one cycle of signal processing with the Control Loop Interval property on the parent event. With plotting on and off, the expected time for a 1000 sample window is ~10 and ~5 ms, correspondingly, given that there are no other processes in the parent event and in the experiment.
- If you are in time-critical section of your experiment, you can temporally cease the signal processing by setting the Is Running property to false.